CELLxGENE
Product direction, researcher workflows, and scientific tools.
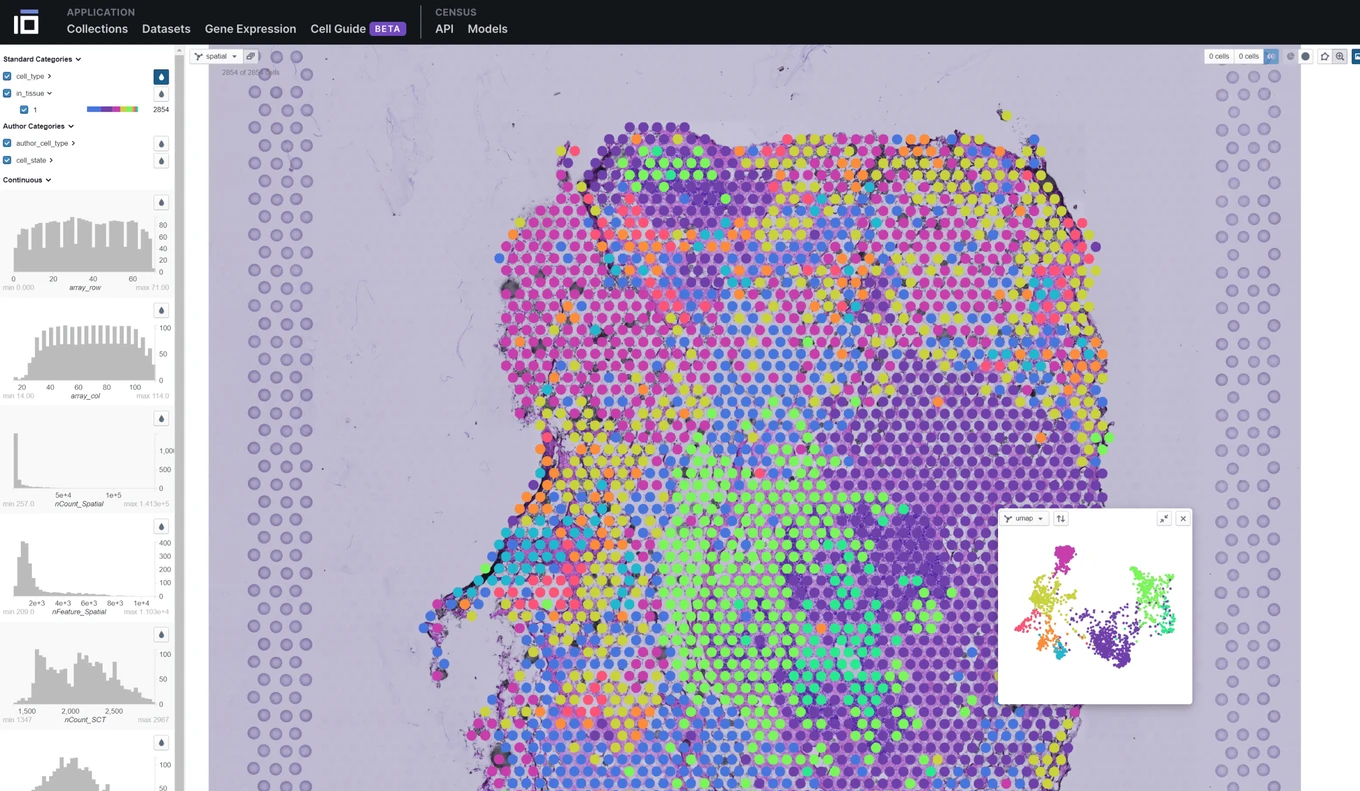
I worked in product on CELLxGENE for roughly three years, helping researchers find suitable data and put it to use. I shaped product priorities and requirements with the team, and built examples around real research workflows. That work contributed to chromatin-accessibility views now live in Explorer, an experimental annotation workflow, and workshops that brought users into ongoing product research.
Bringing chromatin accessibility into Explorer
Joint RNA and ATAC datasets let researchers connect gene expression with the accessibility of the DNA around it. Supporting that work in Explorer meant deciding which views would help a researcher move between cell populations and genomic regions.
I partnered on a discovery sprint that reviewed eight analysis tools and prioritized three views: a shared cell embedding, genomic coverage tracks, and peak-to-gene links. Those priorities gave us a starting point for discussions with the Data Platform team about visualization, ingestion, and storage requirements.
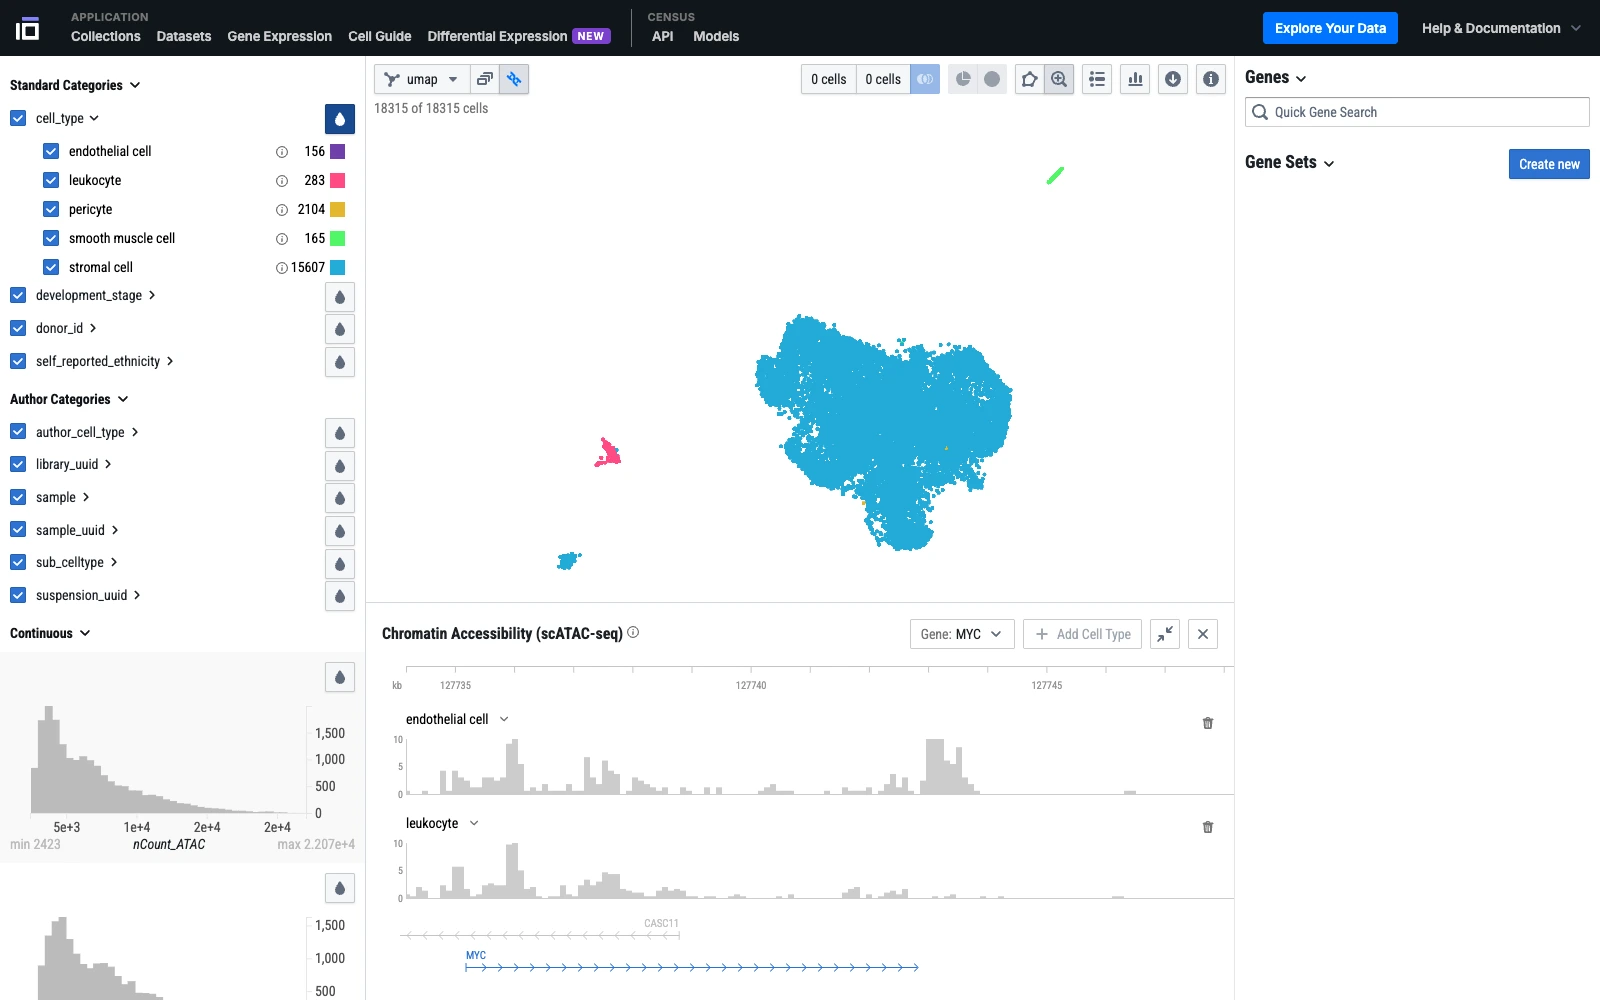
The data requirements evolved through technical discovery. We considered accepting BigWig coverage files, then explored generating coverage from indexed fragment data the platform already supported. The choice affected what dataset submitters would need to prepare and what the platform would need to process and serve.
I also helped clarify the scope of the viewer. Researchers needed to inspect accessibility around a gene and compare cell types; that did not require Explorer itself to run statistical peak calling. A useful coverage view could support exploration while more involved analysis stayed in researchers’ own tools.
Making cell-type predictions useful
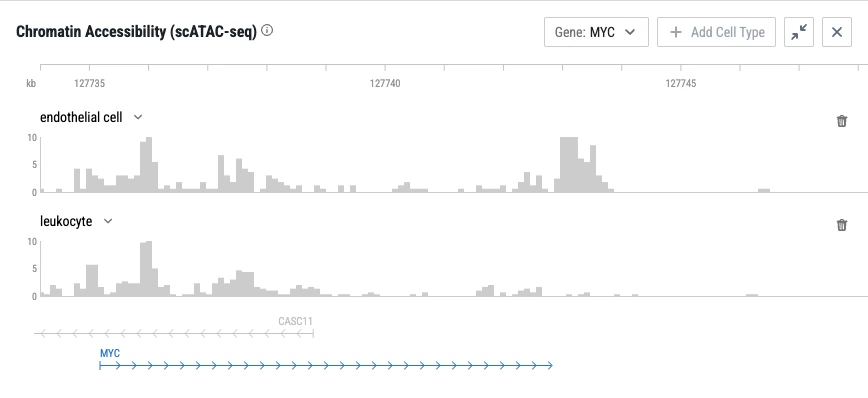
Assigning cell types is an iterative part of single-cell analysis. Interviews with tissue experts surfaced uncertain boundaries between related types, inconsistent label granularity, and the need to check predictions against known marker genes. Researchers also needed to work within their computing resources, sometimes with unpublished data they could not upload.
I helped turn those needs into requirements for the Automated Annotation Engine: model selection, uncertainty reporting, reference projection, and a way to review and revise predictions. A predicted label was a starting point. The researcher still needed to judge uncertain cases and preserve the reasoning behind an annotation.
We considered reference-mapping models and lighter logistic-regression approaches, balancing biological coverage with runtime and ease of use. The experimental workflow made predictions available alongside the data in Explorer, where researchers could inspect expression and refine labels. The review experience mattered as much as the initial prediction.
Predicted cell type
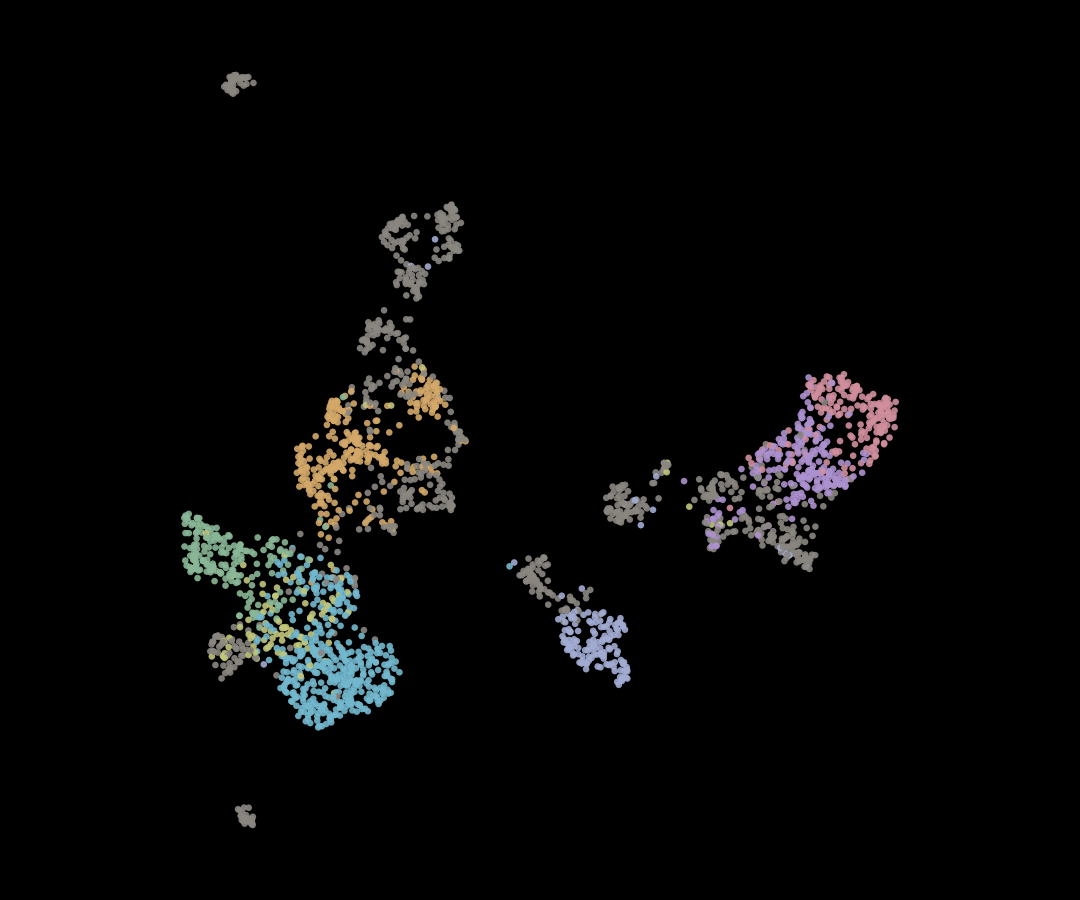
- AT2
- Alveolar fibroblasts
- Monocyte-derived macrophages
- AT1
- Alveolar macrophages
- CD4 T cells
- Basal resting
- Other predicted types
Prediction uncertainty
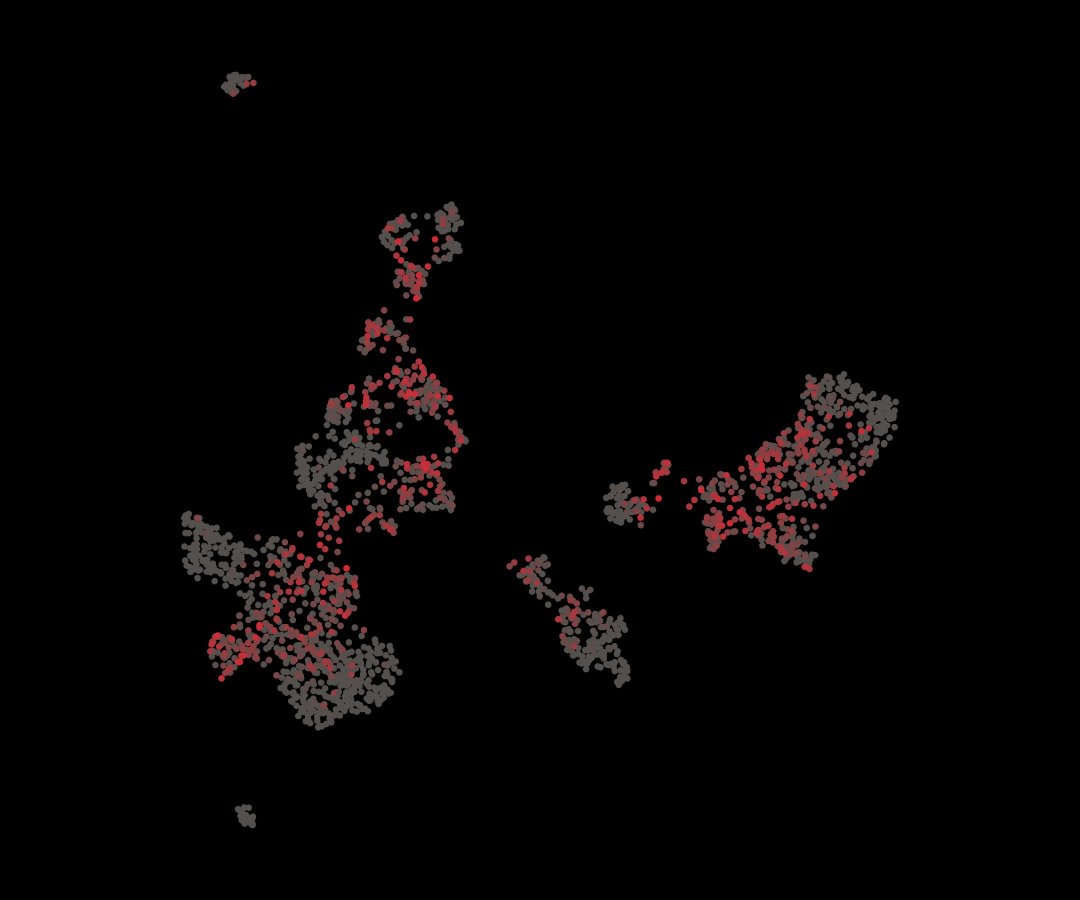
Uncertainty helps identify predictions to inspect. It is a model score, not a calibrated probability.
Following Census into research
Census gives researchers programmatic access to harmonized single-cell data. Publications would take too long to tell us whether it was helping them. I designed and ran interviews around their actual projects: what they were trying to do, where Census fit, and what was getting in the way.
The study included 13 researchers, with repeat interviews with four participants. The conversations showed where consistent annotations and easier data access were useful, but also where institutional computing environments, downloads, and unfamiliar metadata slowed people down.
- Choosing the right data
- Researchers needed help interpreting metadata and selecting the appropriate API functions. That gave us specific documentation and example workflows to revisit.
- Getting a query to finish
- Download friction and institutional compute restrictions raised questions about progress reporting, recovery, and how Census fit into existing infrastructure.
- Knowing when to follow up
- Some participants had not yet adopted Census, and research moved more slowly than our initial check-in schedule assumed. We needed a longer view of use alongside immediate usability feedback.
I brought the findings back to product and engineering against three milestones: whether researchers adopted Census, whether it became central to a research plan, and whether that work was progressing toward a publishable result. The interviews documented use in cross-dataset analysis, model training, and research infrastructure before papers appeared. They also identified people still blocked or not yet using the tool, giving us specific workflows to follow up on.
Teaching with real datasets
I presented Training models on atlas-scale single-cell datasets with the TileDB team at scverse 2024. The notebook moves from querying Census to streaming data into a PyTorch training loop, using a simple classifier to demonstrate the workflow. A separate example uses scVI embeddings to find similar Census cells and predict cell types for a query dataset.
The workshop had 48 registrations, and we recruited 11 researchers for follow-up interviews. Questions about sampling, shuffling, and label hierarchies gave us concrete examples of what people needed when moving from a demonstration to their own training pipeline. The meeting readout distinguished shuffling already available in Census 1.15 from requests for stratified sampling, so we could separate help using existing features from new product requirements.
For a March 2025 spatial-data workshop, I developed examples that query Census, export to SpatialData, and plot measurements over tissue images. Working through the examples exposed practical questions about image scales, coordinate transforms, and recovering author-supplied metadata.
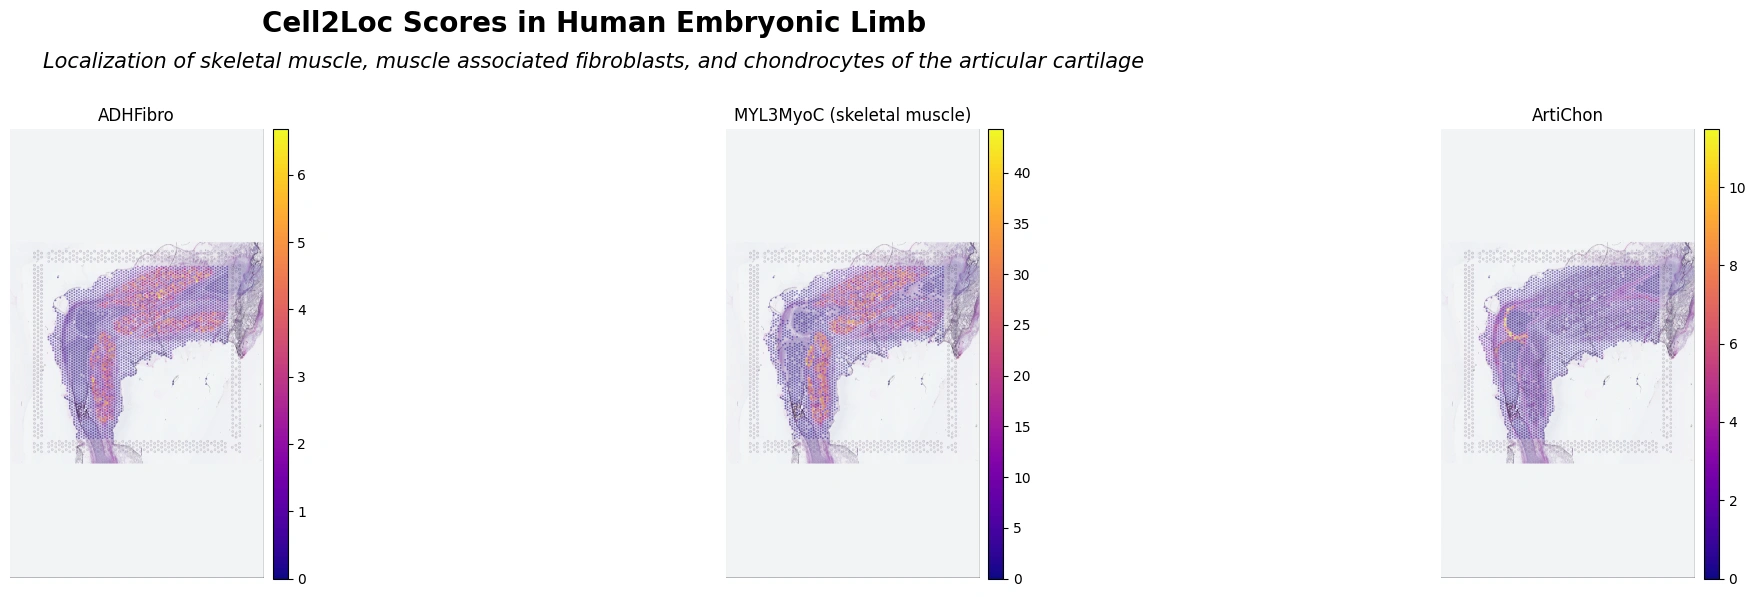
Later in 2025, I co-organized a full day of machine learning programming at scverse with NVIDIA and community contributors.