Chan Zuckerberg Biohub, 2025. Researchers needed a way to inspect VariantFormer's
predictions before setting up an analysis. I led the product and launch work with the AI
research team. We shipped embedded notebooks and an interactive tutorial, with analytics
to follow how people used them and an explainer for the release.
launch post (opens in a new tab)paper (opens in a new tab)model and code (opens in a new tab)
APOE
APP
MAPT
PSEN2
SNCA
Predicted expression across 63 tissues and cell lines at transcriptome scale.
VariantFormer is a 1.2-billion-parameter genomic model built to interpret human genetic
variation in the context of an individual genome. It learns how combinations of variants,
regulatory sequence and tissue context relate to gene activity, producing personalized
representations that can be used for expression prediction, variant-effect analysis and
downstream disease-risk modeling. In the paper, those representations are used to estimate eQTL
effects, study variation across ancestries, stratify Alzheimer’s disease risk and test
counterfactual genetic edits.
Choosing the release use case
The goal was to turn a flexible research model into a release that made its capabilities
clear, differentiated, and useful to researchers outside the team.
I worked with the AI research team to identify the strongest application for the release and
position VariantFormer within the emerging genomic foundation model landscape. The model
supported several possible workflows; tissue-specific gene expression became the lead
experience because it made the effect of an individual genome immediately legible while
demonstrating a capability that was distinct from other models in the space.
A researcher could start with a genome, choose a gene, and see how the model expected its
activity to differ across tissues before moving into more specialized workflows.
The architecture, training, and scientific research were the AI research team’s work. I
owned the product and release layer around that research: positioning the model, defining
the lead experience, and carrying it through technical enablement and external release.
Making predictions explorable
I designed and built the interactive experience around that use case, including the
anatomogram, tissue-level readouts, and tissue clustering. The release site ran on a
markdown-based publishing stack and VariantFormer was not available through hosted
inference, so we used representative model outputs and browser-side interaction to deliver
an application-like experience within the infrastructure we already had.
Explore predicted expression across tissues
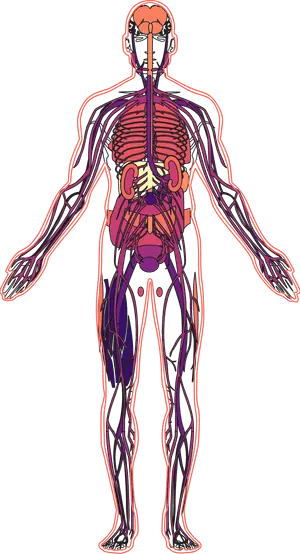
Pick a gene and the body map colours each tissue by predicted expression, with all 63 listed
beside it, ranked by value or grouped by body system.
Loading 17,859 genes across 63 tissues…
About these predictions
One individual
Every value shown is a prediction for a single individual genome. A different genome would
produce different predictions.
15 tissues map to broader anatomy
Fifteen of the 63 tissues do not have a dedicated region on the anatomogram, so they are
mapped to a broader anatomical region. The interface identifies that region on hover.
10 are cell lines
Ten of the 63 outputs are cultured cell lines rather than anatomical tissues. They appear in
the histogram but not on the body map.
Explore predicted expression across the transcriptome
Everything above shows one gene across 63 tissues. Below is the full prediction matrix:
17,859 genes by the same 63 tissues, with tissues clustered by predicted profile. Colour
is each gene’s z-score across tissues, so brightness is relative to that gene
rather than absolute expression. Select a row to update the gene above, or drag to zoom
into a region of the matrix.
APOE, and the 27 highest of its 63 tissues. The interactive version needs a wider screen:
it loads about 1.7 MB of predictions, and it shows the tissue detail on hover, which a
touch screen cannot do.
About these predictions
One individual
Every value shown is a prediction for a single individual genome. A different genome would
produce different predictions.
15 tissues map to broader anatomy
Fifteen of the 63 tissues do not have a dedicated region on the anatomogram, so they are
mapped to a broader anatomical region. The interface identifies that region on hover.
10 are cell lines
Ten of the 63 outputs are cultured cell lines rather than anatomical tissues. They appear in
the histogram but not on the body map.
How the matrix works
One matrix, two views
The gene explorer and genome-wide map use the same 1.07 MB quantised matrix of saved
VariantFormer predictions. The heatmap does not fetch another dataset; it redraws the
matrix already in memory as 17,859 genes by 63 tissues.
Rendering 17,859 genes
At full extent, 17,859 rows have to fit into roughly 700 screen pixels, so the browser
cannot display every row individually. It samples rows at the overview level, then renders
every gene in a selected region when you drag to zoom.
Client-side interaction
Gene selection, tissue ordering, the anatomogram and heatmap all run in the browser.
Supporting metadata loads only when needed, and the interactive experience does not
require an application backend or send data to a third party.
Attribution
The model, anatomogram artwork and tissue mappings come from
czi-ai/variantformer, MIT licensed.
Tissue descriptions come from UBERON. The interaction layer on this page is a new browser
implementation built against the published model outputs.
Delivering the release
Technical enablement and scientific communication
Built the end-to-end technical workflow around the model, including the
marimo notebook from VCF input through inference and
interpretation. I also developed the walkthroughs, demos, and scientific communication
materials used to explain the model externally, including artifacts shown at
NeurIPS.
Launch strategy and execution
Shaped the external launch across narrative, sequencing, and deliverables. I authored
Genomics research for
all for the Biohub blog and brought together the interactive experience, technical
documentation, demos, and launch materials into a coherent researcher-facing release.
Trying the model inside the tutorial
Researchers previously had to leave the page and launch an external notebook to inspect
its outputs. I prototyped embedded marimo notebooks and worked with engineering to bring
them into the platform’s markdown-based tutorials. Engineering productionized the
integration; I developed the experience and helped validate the approach.
Learning from the tutorial
Embedding the notebooks gave researchers another way to inspect the model’s outputs.
We also needed a way to learn whether that experience was useful. I worked with
engineering and analytics to make the tutorial measurable: notebook loading, scrolling
within the embedded content, and clicks through to code and external notebooks.
VariantFormer launched with four embedded notebooks in the tutorial and one in the
Quickstart, the first model on the platform to use this format. The instrumentation
shipped with it. In the release review, we could follow visitors from the model card
into the tutorial, distinguish notebook loading from scrolling, and identify where
people stopped before reaching the content.
Two routes into notebook content · November 6–19, 2025
Measured action
Visitors
Scrolled at least 25% through an embedded notebookAmong 59 visitors in the notebook-loaded funnel
Launch-window readout. These measure different actions and starting populations:
scrolling through embedded content and opening an external notebook. Neither records
running an analysis.
Could visitors reach the notebook?
Quickstart page-depth data suggested many visitors stopped before the notebook’s
position. That made moving it earlier a concrete follow-up to test.
What did engagement tell us?
Scroll events showed use of the embedded content, but time on page was harder to
interpret: a short visit could mean finding an answer quickly or leaving without one.
Measures of running or editing cells would help us understand what happened next.
I helped interpret the readout and turn it into recommendations for the next iteration.
Setting up this feedback process gave the team a way to assess the tutorial after release
and choose the next product questions to investigate.
Making the model legible
VariantFormer needed a concise way to explain a model whose capabilities span personalized
expression prediction, variant effects, and counterfactual editing. I wrote, designed, and
produced a 1:25 explainer that became a primary visual asset for the launch and was later
shown at NeurIPS. Built in Remotion, it translates
the model’s core ideas into a sequence of programmable figures and animations rendered
from React.
From individual genetic variation to tissue-specific expression and in-silico editing,
compressed into the narrative used to introduce VariantFormer externally.
 APOE
APOE 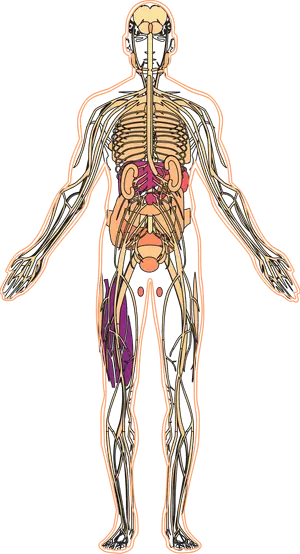 APP
APP 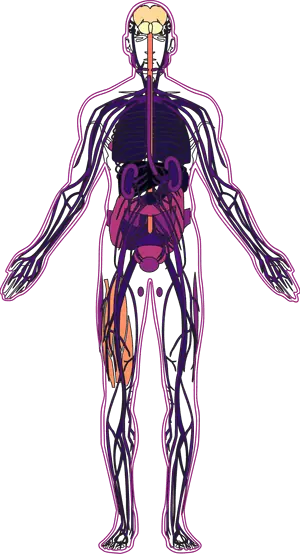 MAPT
MAPT 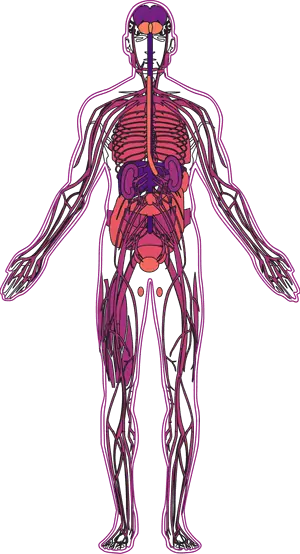 PSEN2
PSEN2 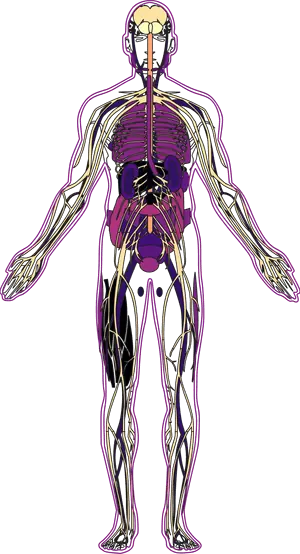 SNCA
SNCA 